
A while ago, Google announced that they would be effectively deleting all Universal Analytics (i.e., Google Analytics 3) profiles and data at the end of June 2024. Well, that day is almost here!
Google hasn’t made it very easy to extract a copy of all our data. They have a Google Sheets template that pulls allegedly popular reports, but to me, this feels pretty token. I wouldn’t consider any of the standard reports popular or insightful.
I’ve spent some time enhancing the Google-provided spreadsheet to pull down a lot of the most important data from GA3. There’s so much gold in historical data analysis, and my strategy was to capture as much daily information as possible. While GA3 and GA4 data models aren’t directly comparable, having a timeline of pageviews and sessions of users as far back as possible—with a note at the cutover point—is much better than having no historical context.
How to use the archiving template
Here is the template: {Template} – Google Analytics 3 Archiver.
First, make a copy of the template to your own Google Drive.
- Ensure you have the Google Analytics plugin installed in your Google Sheets. You can install it from here.
- Add your Google Analytics View ID at the top of the Status sheet.
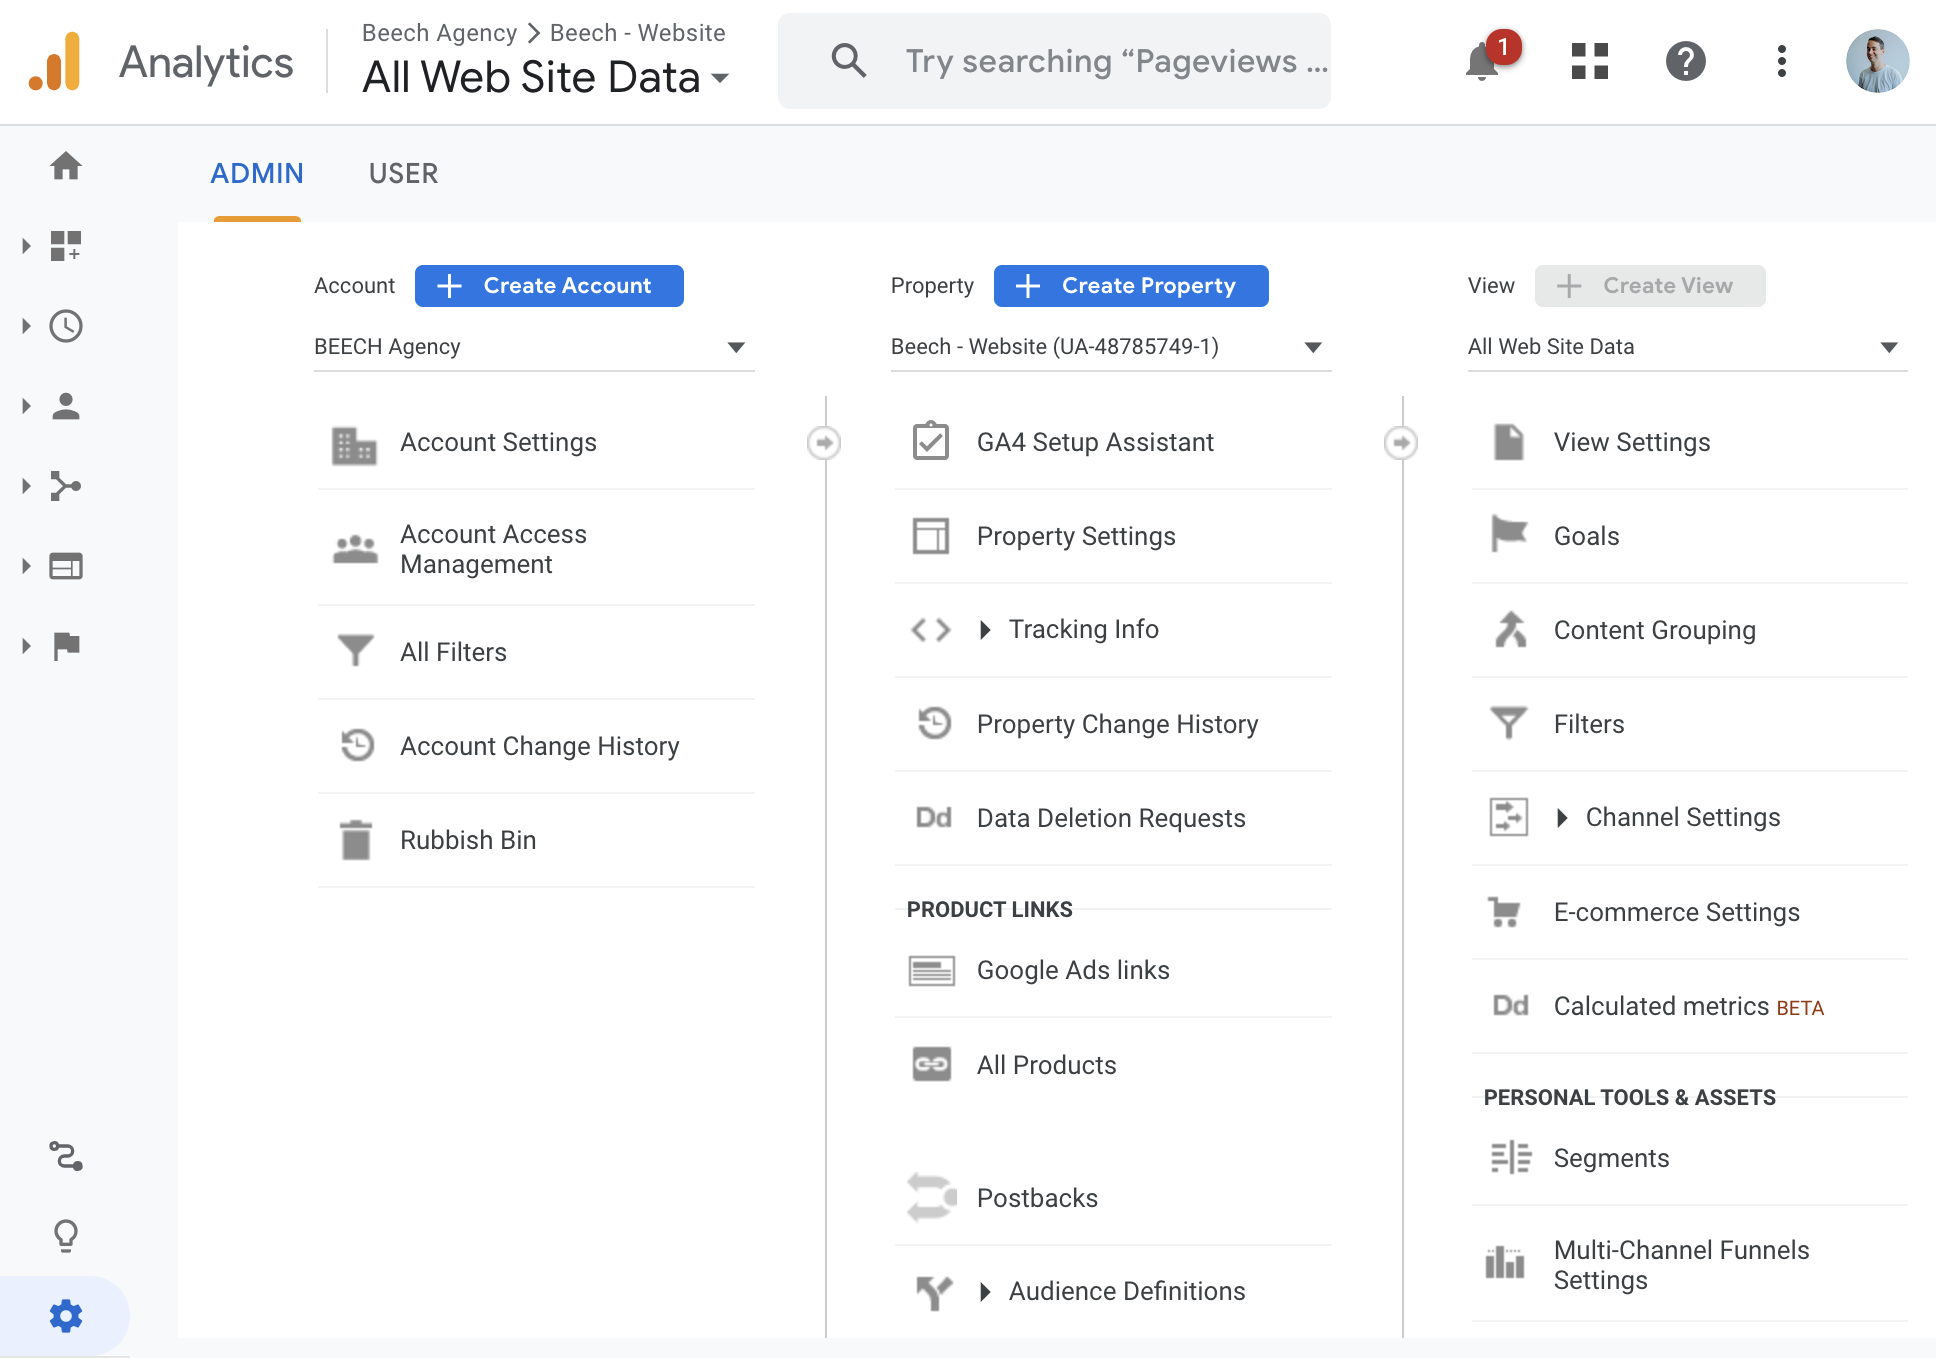
- You can get your View ID by logging into your Google Analytics 3 account and clicking the admin icon in the bottom right (it’s a cog icon).
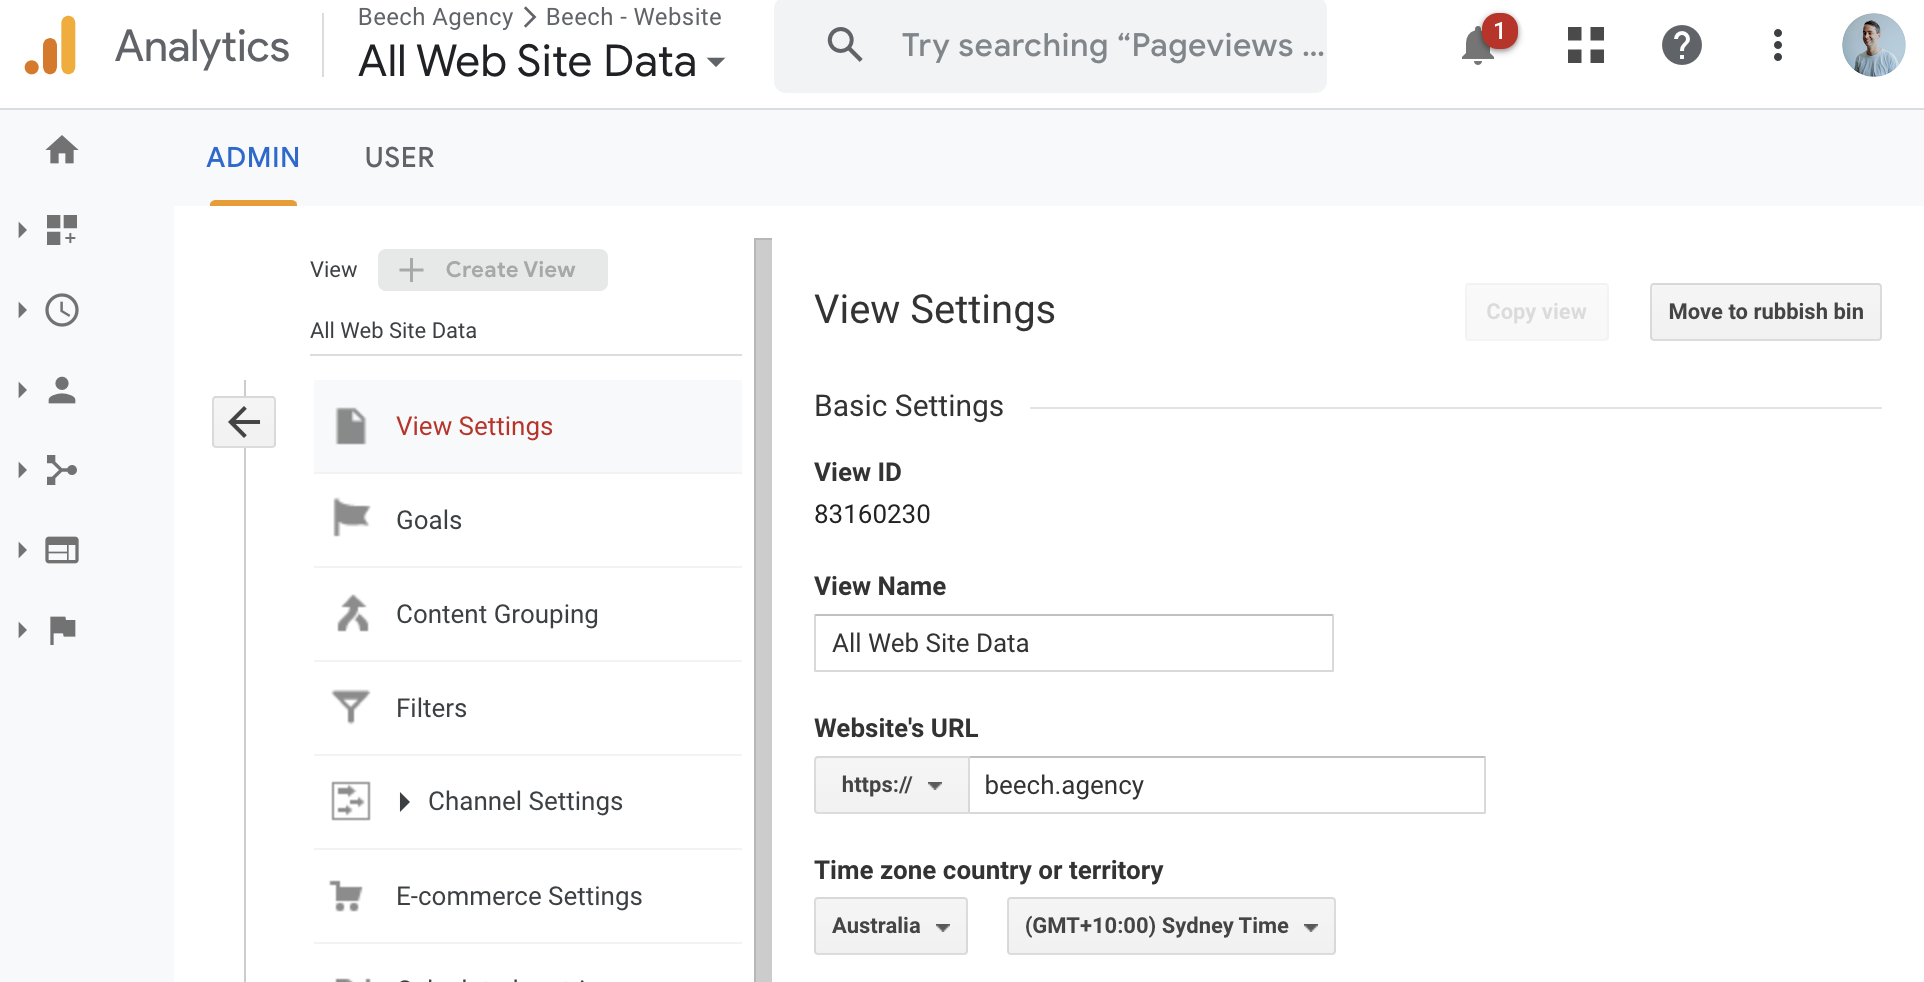
- Then, click View Settings.
- Copy the View ID.
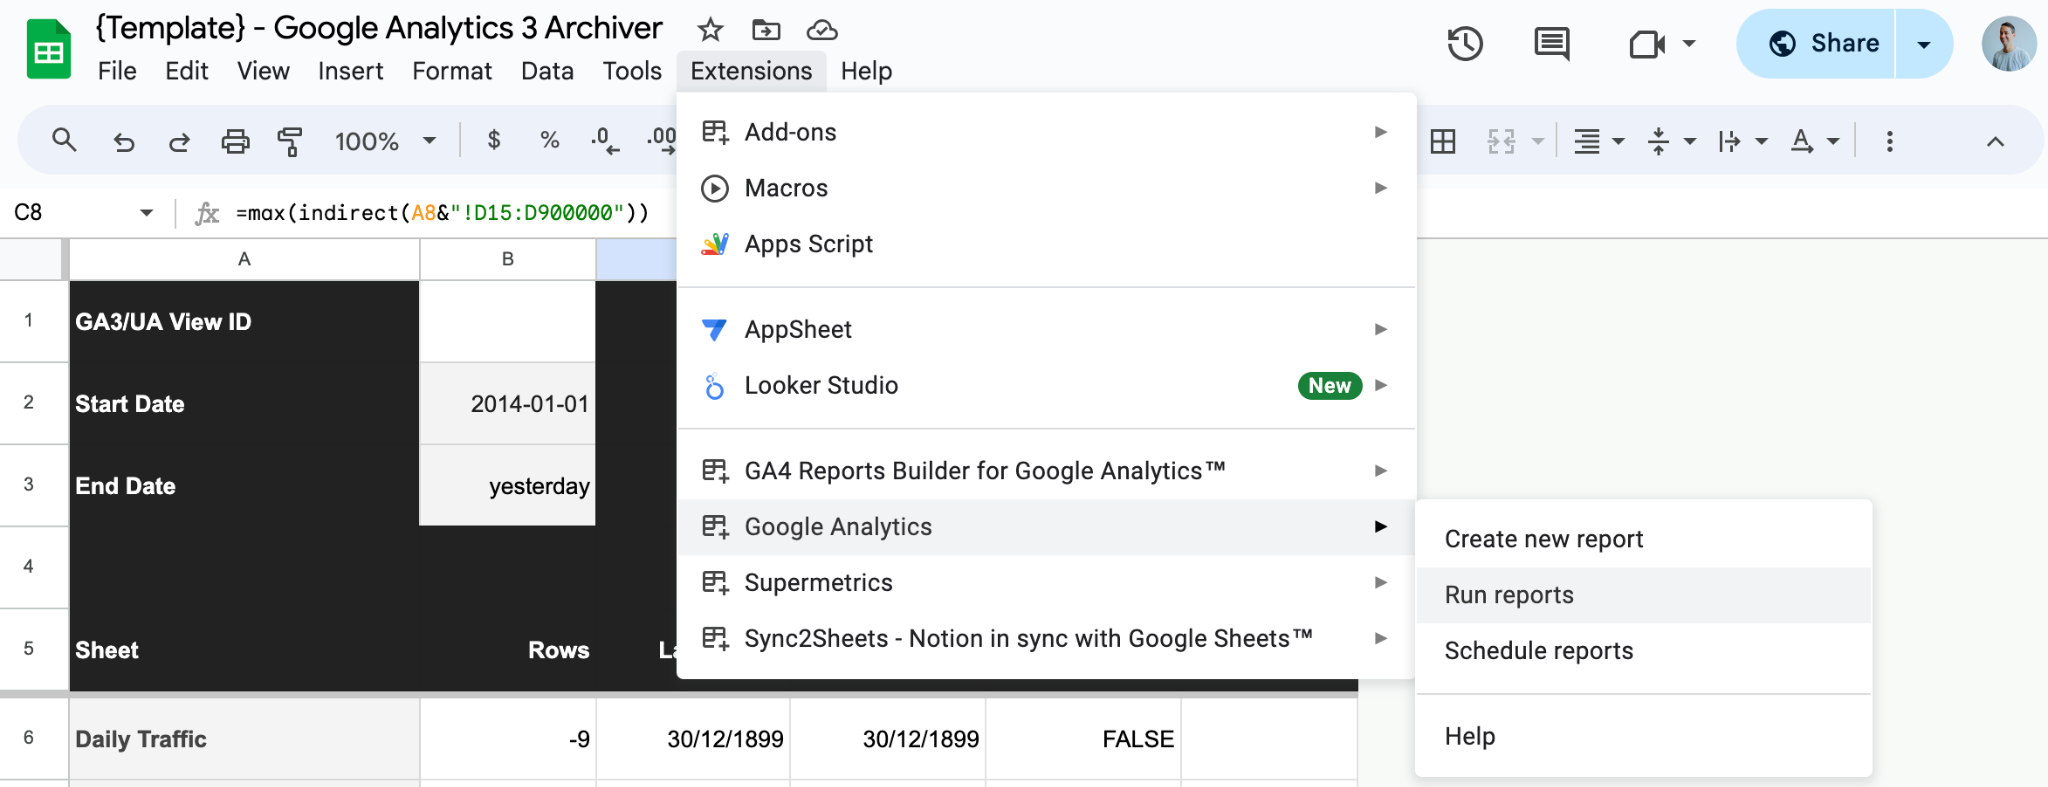
- Back in the template, set the start date to the earliest date you have in your Google Analytics, or from the earliest date you would like to pull data from.
- Now, run the report by clicking Extensions, then Google Analytics, and then Run reports. It will take a few minutes to run, depending on the size of your site.
All done! Bask in the glory of 18 sheets of historical Google data that you have extracted and made safe from deletion.
Troubleshooting
If you have a large site with a lot of historical data, the report may either time out and break or only return partial amounts of data. Google Sheets has a limitation of 10 million cells per workbook, and a site with a long history will definitely utilise it all.
To navigate this, you will need to pull the data down in pieces—i.e., batch it.
To batch your reports, you will need to:
- Start with the latest date possible, then set the start date a year or two before that, and run the report. Hopefully, it will return this batch.
- Then make another copy of the spreadsheet and set your ID.
- Set the dates with the end date as the day before the start date of the previous run and repeat the process.
Alternatively, if you are consistently hitting the cell limits, make duplicate copies of the sheet and remove half of the reports in the report configuration (just delete the columns).
There are 18 different reports. If you split these over 5–9 different sheets, you should be more than fine.
GA3 Quirks to note
GA3 has several data quirks to be aware of:
Users as a Dimension: This dimension is quirky. It was added to GA later than sessions and pageviews. It’s also different from sessions and pageviews and can only be used with specific metrics and dimensions.
Default Channel Grouping: This was added in 2021. Attempting to pull data using that dimension as part of the request will only return data from 2021 onwards, even if data for other dimensions exists prior to 2021.
Product Category: This was causing all ecommerce reports to return nothing. I believe there was some… weirdness… when Enhanced Ecommerce was introduced to GA3, causing conflicts between the old and new Product Category dimensions. It’s a bummer but not essential.
URLs with Query Strings/Parameters: I’ve removed URLs with query strings/parameters from the page reports. For most users, this data would be junk or contribute little, and I kept hitting cell limits without the filter. To display them, remove ga:pagePath!@? from the filters row in the report configuration tab.
Wrapping up
June 30 marks the end of an era. GA3 was an amazing tool that I really treasured. I still don’t think GA4 is an adequate replacement, but it is getting better.
Sadly, we’re going to lose the ability for the deep segmentation analysis that GA3 enabled—we just can’t pull the data out of GA3 in a format that would allow for that (unless you pulled every segment individually you wanted to store now). However, archiving some of the data is better than losing it all.
Good luck, and I hope this guide is helpful for you!
If this gets enough momentum, I’ll look at creating some Looker Studio data visualisations on top of it or a guide to pulling all the data into BigQuery to make it more malleable. For now, extracting the data is the priority.